Every freely-traded market makes a series of turning points that tend to occur during the day session of the regional stock market. They can range in number from two to four, but about 80% of the time there are three: HI-LO-HI or LO-HI-LO. You don’t need to master complex cycle theories or pay to join some elite trading group in order to recognize and utilize daily turning points. I can teach you how to spot them and exploit them with conventional technical analysis.
Scoreboard
ES: 7 wins / 0 losses
Mentoring Moment
Technical indicators have at least three important functions. First, they act as a point of reference for price movement; second, they act as a filter to remove the unnecessary “static and noise” from price movement; and third, they allow us to see the alignment of momentum on multiple time frames. Consider a trio of moving averages of varying speeds like my RED, WHITE and BLUE MAs. The navy blue 5-bar MA moves a bit slower than the actual price, so if the candlesticks are above the navy blue line, I know prices are rising on the short term. In addition, the 5-bar MA moves with a straighter line with gently rounded turns and none of the hectic zigging and zagging of the actual candlesticks. Lastly, when I combine that MA with my white 13-bar and my red 34-bar MAs, I can tell if the price is moving in a with-the-trend impulse wave or a counter-trend corrective wave. The former will present a bullish or bearish RED, WHITE & BLUE alignment. The latter will probably be RED, BLUE & WHITE.
Chart Chat
Today’s 3-minute chart shows a HI-LO-HI configuration skewed toward the earlier end of the day session. Have a great evening. Be back tomorrow.
Please click on the chart below to make it larger.
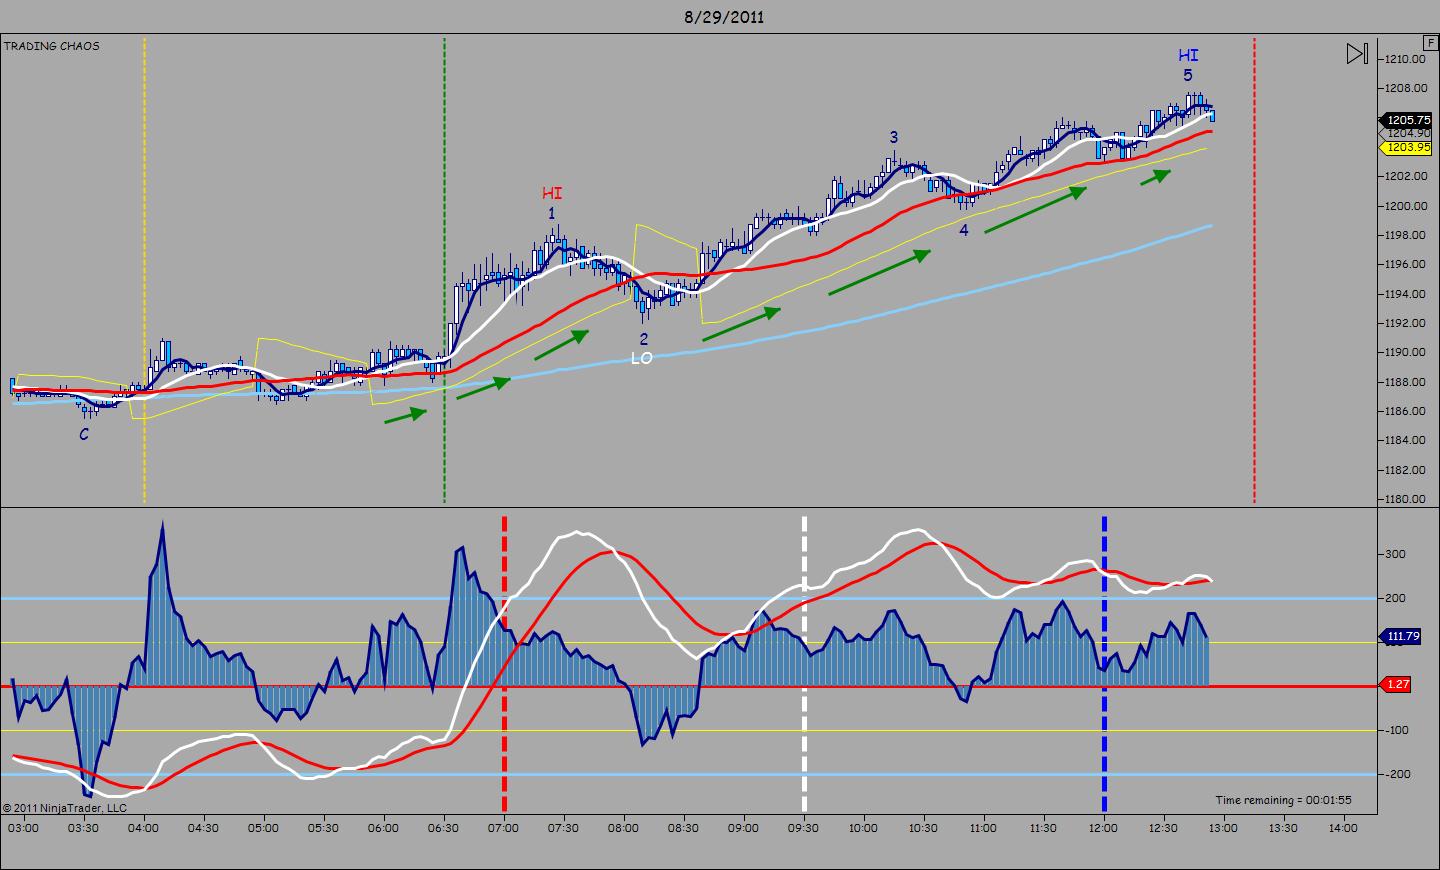
Today’s 3-Minute ES Chart