Every freely-traded market makes a series of turning points that tend to occur during the day session of the regional stock market. They can range in number from two to four, but about 80% of the time there are three: HI-LO-HI or LO-HI-LO. You don’t need to master complex cycle theories or pay to join some elite trading group in order to recognize and utilize daily turning points. I can teach you how to spot them and exploit them with conventional technical analysis.
Scoreboard
ES: 8 wins / 0 losses
Chart Chat
Today’s 3-minute chart shows a HI-LO-HI with the first HI coming early in the pre-market. The YELLOW arrows represent good trades that I couldn’t take because I was delivering my webinar on TECHNICAL ANALYSIS. Speaking of which, I will be giving it again tomorrow at 1:15 pm PDT for Ninja Trader. If you would like to see it or see it again, check out the Ninja web site for details. Have a great evening. See you tomorrow.
Please click on the chart below to make it larger.
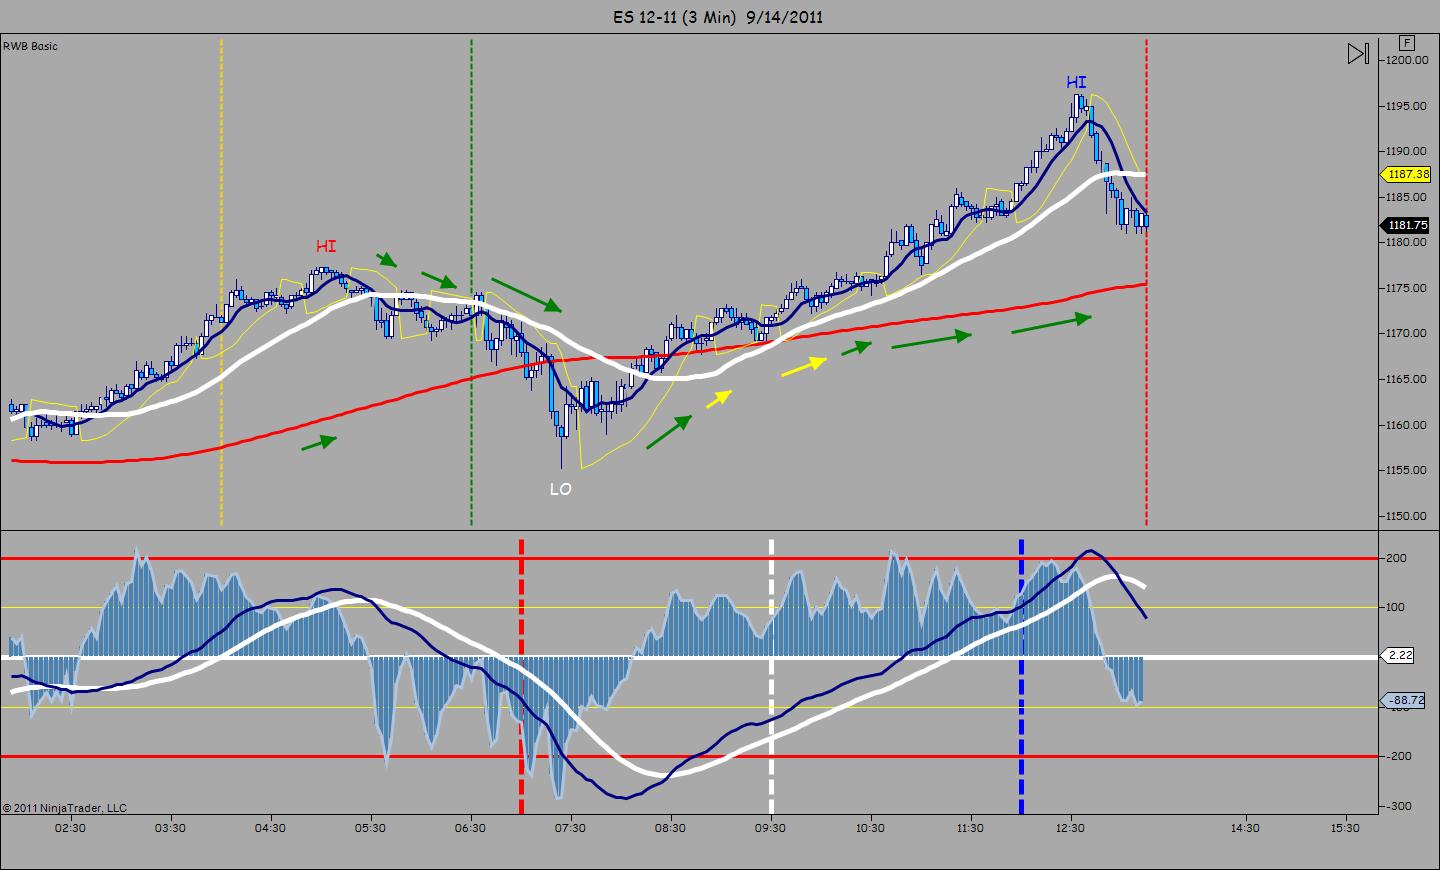
Today’s 3-Minute ES Chart