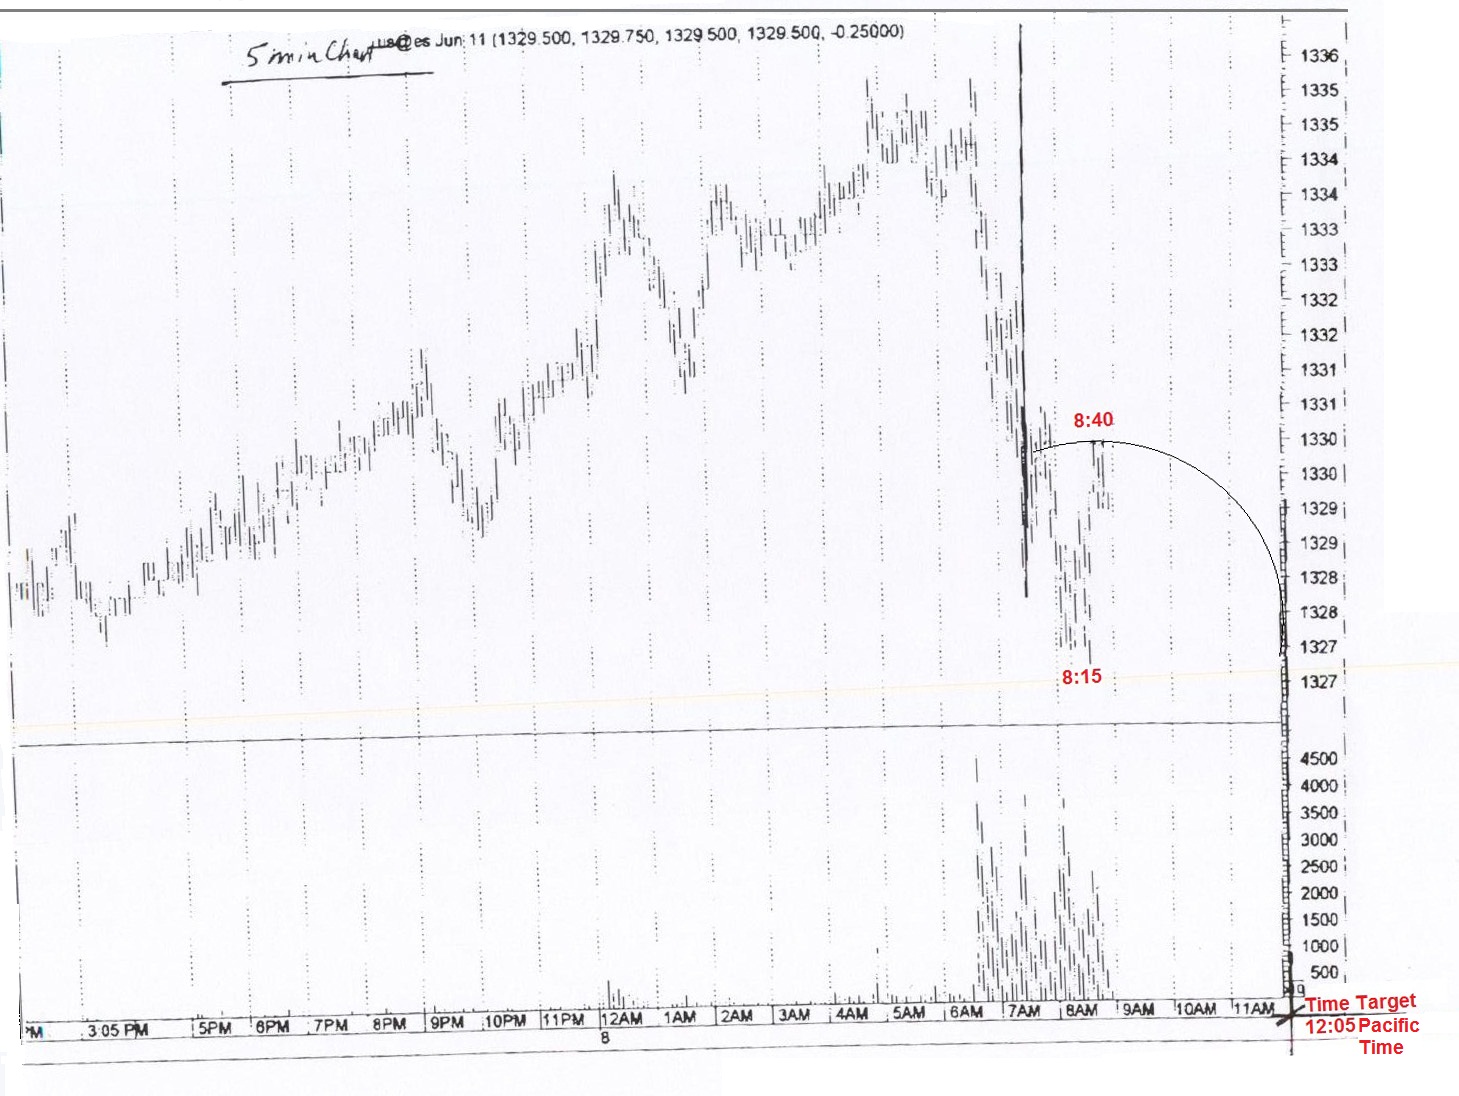
The charts of the 5 minute e-mini show a precise application of a geometric time projection I made earlier this morning. The use of a circle drawn with its center at the bottom at 8:15 and its circumference point at the high of 8:40, projected a time target of 12:05. The second chart shows the bottom that formed at exactly that time. I placed a sell stop at 1325.25 at 10:55. I projected a price target of 1321. The buy limit at 1321 took me out of 1/2 of my positions. I exited the remaining positions at 1322. This time projection which I discussed in the last Webinar presentation, enabled an almost surgical exit from the short, as it coincided with the low of the day, even though my price target was slightly off.
Please click on the charts to make them full screen.