Every freely-traded market makes a series of turning points during the day session of the regional stock market. You don’t need to master complex cycle theories or pay to join some elite trading group in order to utilize daily turning points. I can teach you how to spot them with conventional technical analysis. . .
Scoreboard
ES: 5 wins / 0 losses
Chart Chat
Every one of the EWT turning points I labeled on today’s chart is consistent with the EWT rules and guidelines discussed in my webinar last Friday. In addition, every ending/starting wave point is at the highest high or lowest low within its own separate Parabolic SAR “momentum module.” In the future, when faced with multiple possible wave counts, I will definitely go with one that makes use of every momentum module. I have often said that there is no objective standard we can use to verify if our EWT count is correct. Perhaps that is not completely true. Maybe Ninja’s default Parabolic SAR applied to a 3-minute chart is a close approximation of such an objective standard. Interesting.
Today’s pattern was a HI-LO-HI. The first two points were quite close to their predicted times. The final HI was slightly late as is expected in a strong trend. Have a great evening. Be back tomorrow.
Please click on the chart below to make it larger.
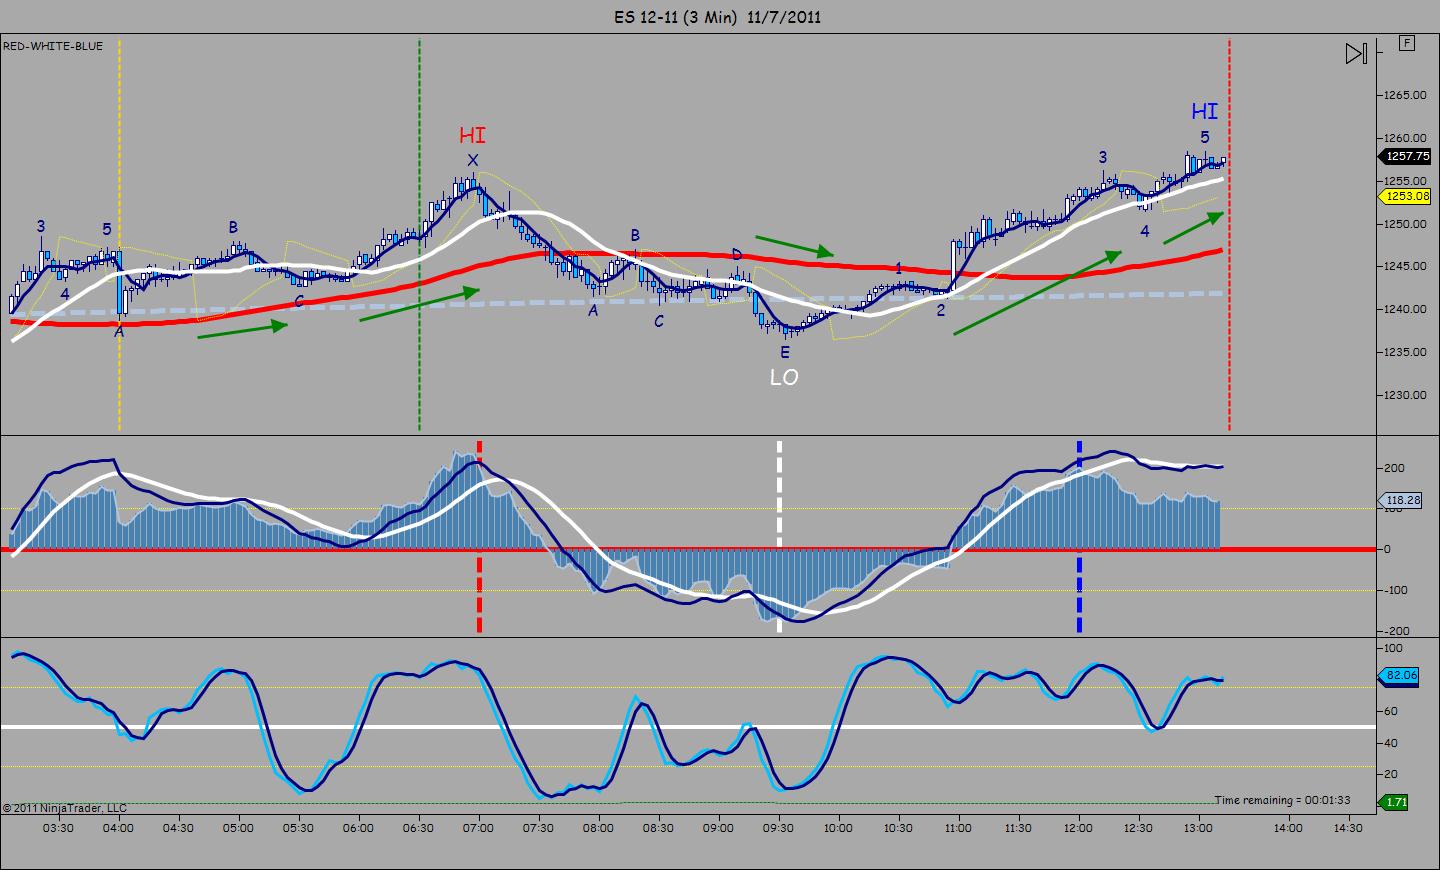
Chart #1