Every freely-traded market makes a series of turning points during the day session of the regional stock market. You don’t need to master complex cycle theories or pay to join some elite trading group in order to recognize and utilize daily turning points. I can teach you how to spot them and exploit them with conventional technical analysis.
Scoreboard
ES: 9 wins / 0 losses
Chart Chat
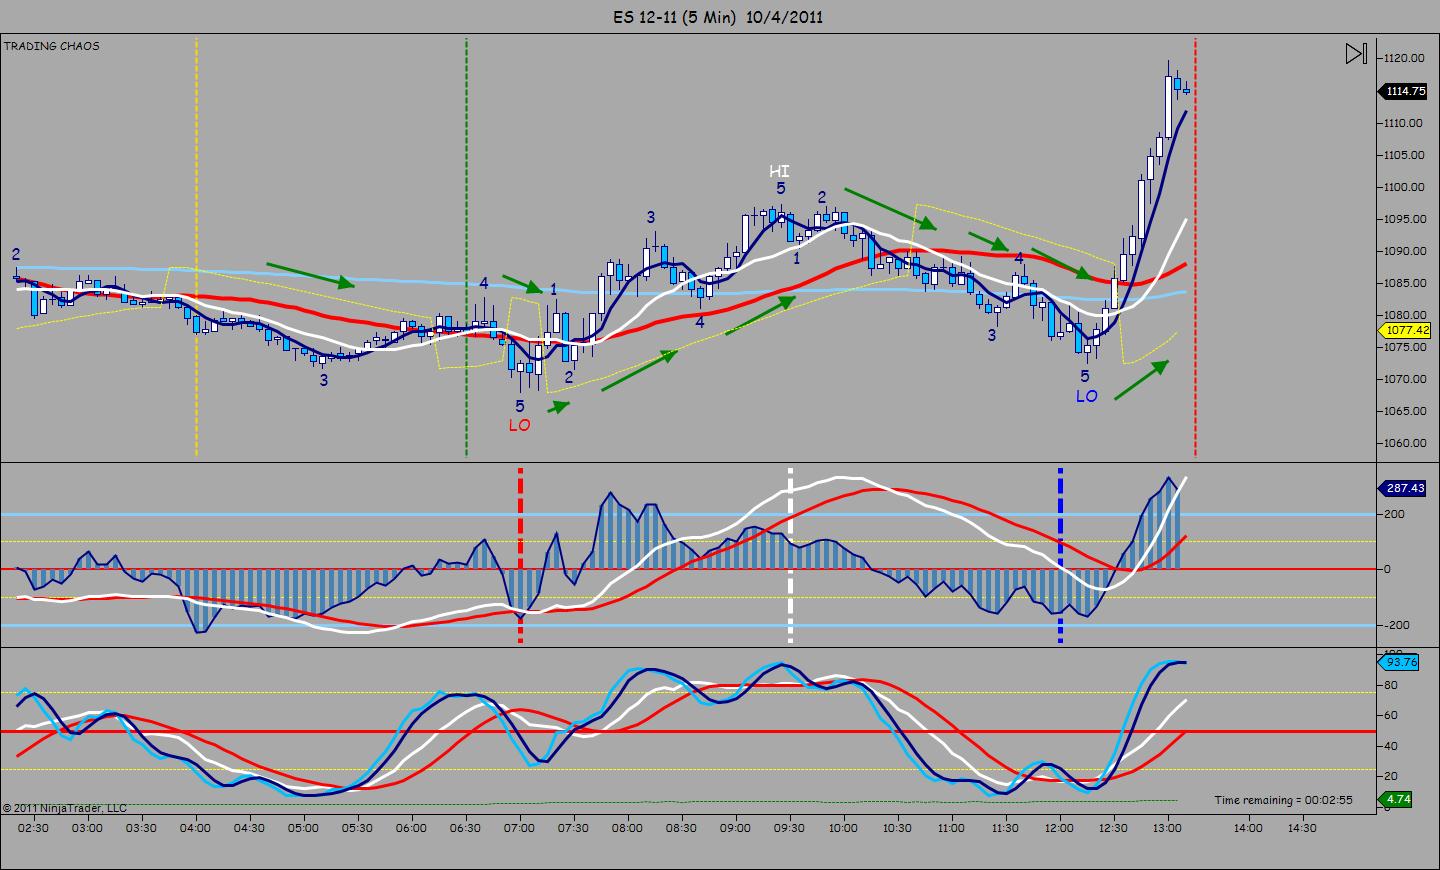
Today we can see a basic LO-HI-LO pattern. I also continued my EW practice. I’m back to using the 5-minute chart in the blog because it shows the daily turning points a bit better than other time frames. For actual trading, I might look at 1, 3, 5, 13, or even 21. Have a great evening. Be back tomorrow.
Please click on the chart below to make it larger.
Today’s 5-Minute ES Chart